Reduce infrastructure costs by blocking abusive traffic early
Measure requests stopped (blocked + challenges not solved) and see who tried to consume your resources. Use the calculator below to estimate infrastructure savings using your own cost assumptions.
Awarded and supported by


Calculator
Estimate your monthly cost savings from traffic stopped before origin.
Start with the only number you already have: monthly requests from basic analytics. We apply a baseline automated split and estimate savings potential for workloads.
- Baseline automated traffic
- 32% bad bots + 17% good bots = 49% automated.
- Cost assumption
- 150,00 € per 1M requests (baseline for dynamic/origin-heavy stacks).
- Reality check
- Real savings depend on what reaches origin (CDN caching vs APIs) and what work executes per request.
Monthly requests
Range: 1,000,000 – 1,000,000,000
5,000,000requests/month
Estimated automated requests/month (baseline)
2,450,000
Estimated infrastructure savings (baseline)
367,50 €
How we estimate savings
Savings ≈ (requests/month × 49%) ÷ 1,000,000 × €150
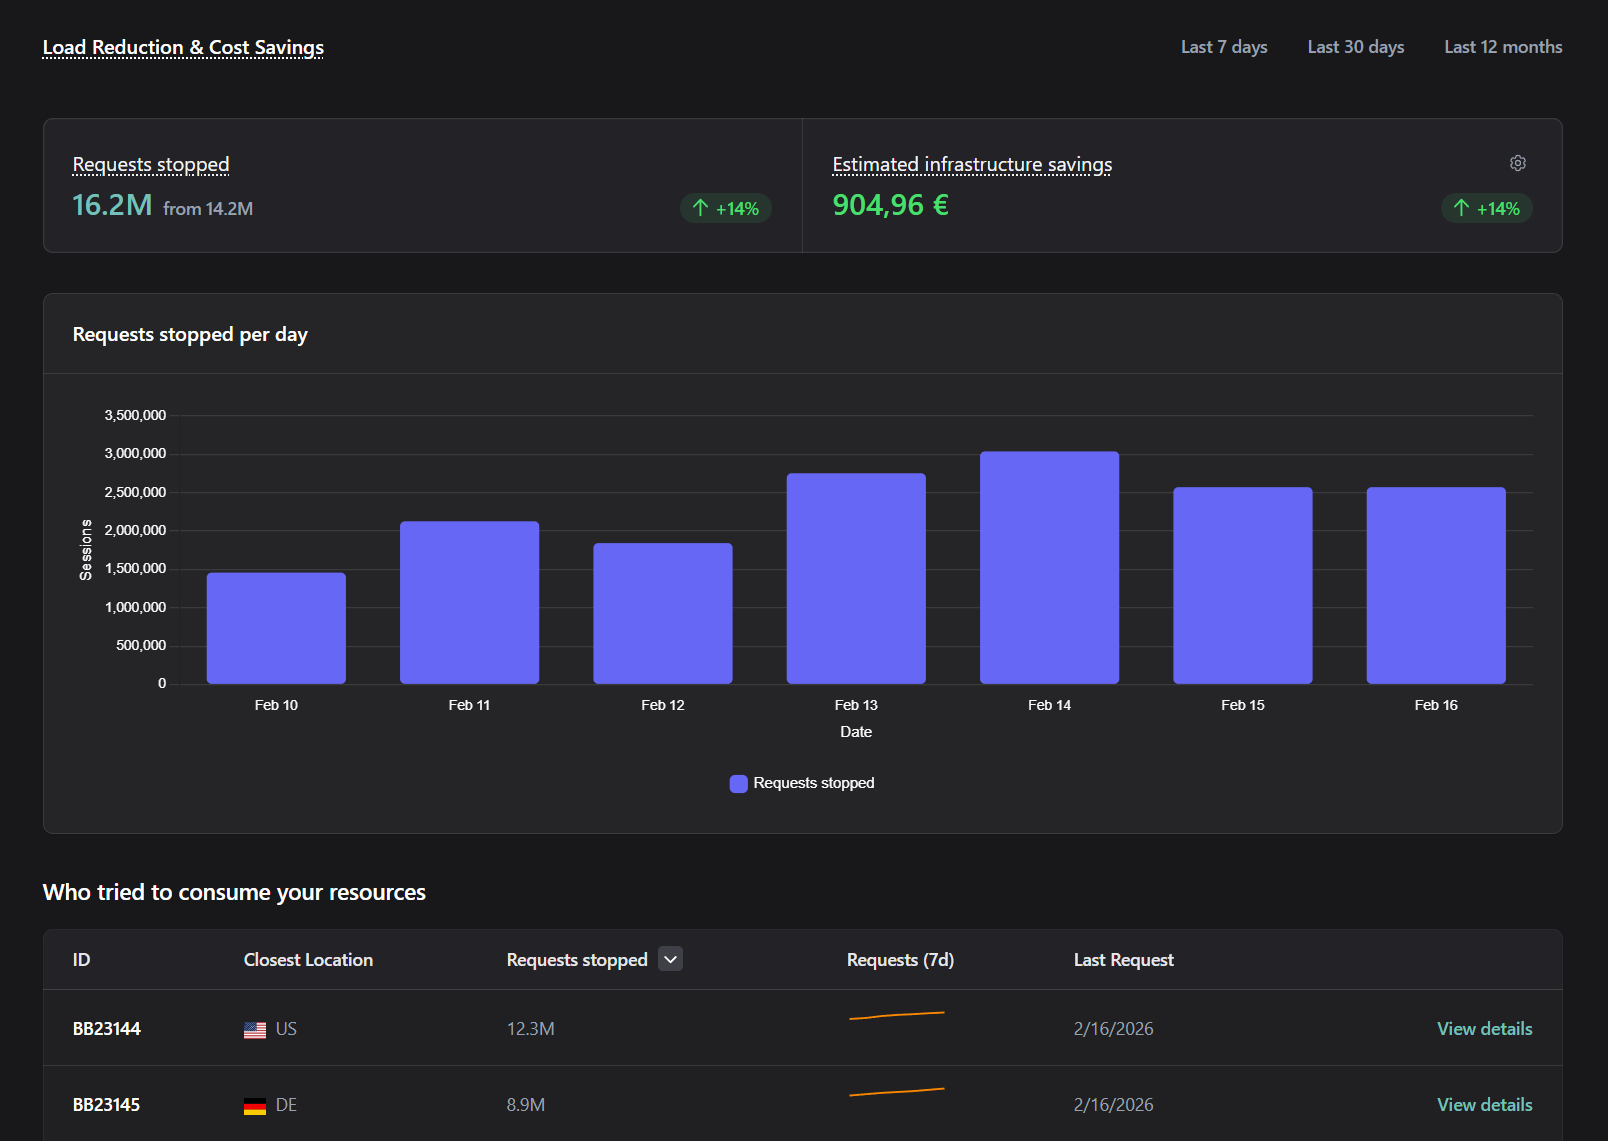
Trends & Attribution
See what was stopped and who caused it.
- Requests stopped over time
- Blocked requests and unsolved challenges in one trend.
- Who caused the load
- Source-level attribution for abusive traffic.
- How often it repeats
- Recurring bursts before origin capacity is hit.
- What it saves
- Savings estimates from your monthly request volume.

How it works
Reduce load without slowing down your site with pre-origin enforcement.
Enforce decisions before origin and measure outcomes in the admin-panel.
- Decide in real time
Integrate the check-request API to get a decision for each request: allow, challenge, or block.
- Stop before origin
Blocked requests and challenges not solved never reach your APIs or pages — reducing waste and protecting capacity.
- Measure “requests stopped”
In the admin-panel, “Requests stopped” is the sum of blocked requests and challenges not solved — requests that did not reach your origin.
European Trust
Built for European trust from the Austrian Alps with strong, simple, privacy-first protection.
- Visitors analyzed
- >400M
- Platforms protected
- >1k
- Data residency
- EU only
- Compliance model
- GDPR-first
Frequently asked questions
Want to see the real dashboard? Create an account and explore the Load Reduction view.
- What exactly is “Requests stopped”?
- It’s the sum of requests blocked and challenges not solved — all requests that did not reach your APIs or pages.
- Is the cost-savings estimate exact?
- It’s an estimate. We start from your monthly requests and apply a baseline automated-traffic assumption to estimate savings potential.
- Where should we integrate the check-request API?
- On your server, reverse proxy, or CDN/edge layer — wherever you can enforce allow/challenge/block decisions before origin.
- Can we see which sources were stopped?
- Yes. The admin-panel includes a “Who tried to consume your resources” view with identity, closest location, and stopped-request trends.
Testimonials
Trusted by teams across Europe who rely on Bot Shield to protect applications, APIs, and infrastructure.
“Atmosvere was easy to integrate, simple to run, and the team behind it provides highly responsive, personal support whenever needed.”

“Atmosvere gave us full control over automated traffic. We reduced unnecessary load, blocked bots, managed crawlers, and improved system stability—while also strengthening our marketing activities without impacting real users.”

“Anyone who uses Atmosvere is sending a clear signal about a sustainable and digitally ethical platform economy.”

“Atmosvere is really easy to implement and has been evolving quickly - the team is always open in providing new insights and turning feedback into real improvements.”
Reduce load and reclaim spend
Stop abusive traffic early, quantify requests stopped, and estimate savings with your own cost assumptions.